wf_scc: A python sliding-window cross-correlation (SCC) function
Last updated: 2025-07-23
Introduction
Waveform cross-correlation is widely applied in seismology for various purposes, including template matching, differential travel time estimation. Below figure is a simple demo that illustrates how sliding-window cross-correlation (scc) could help in refining phase-picking consistency.
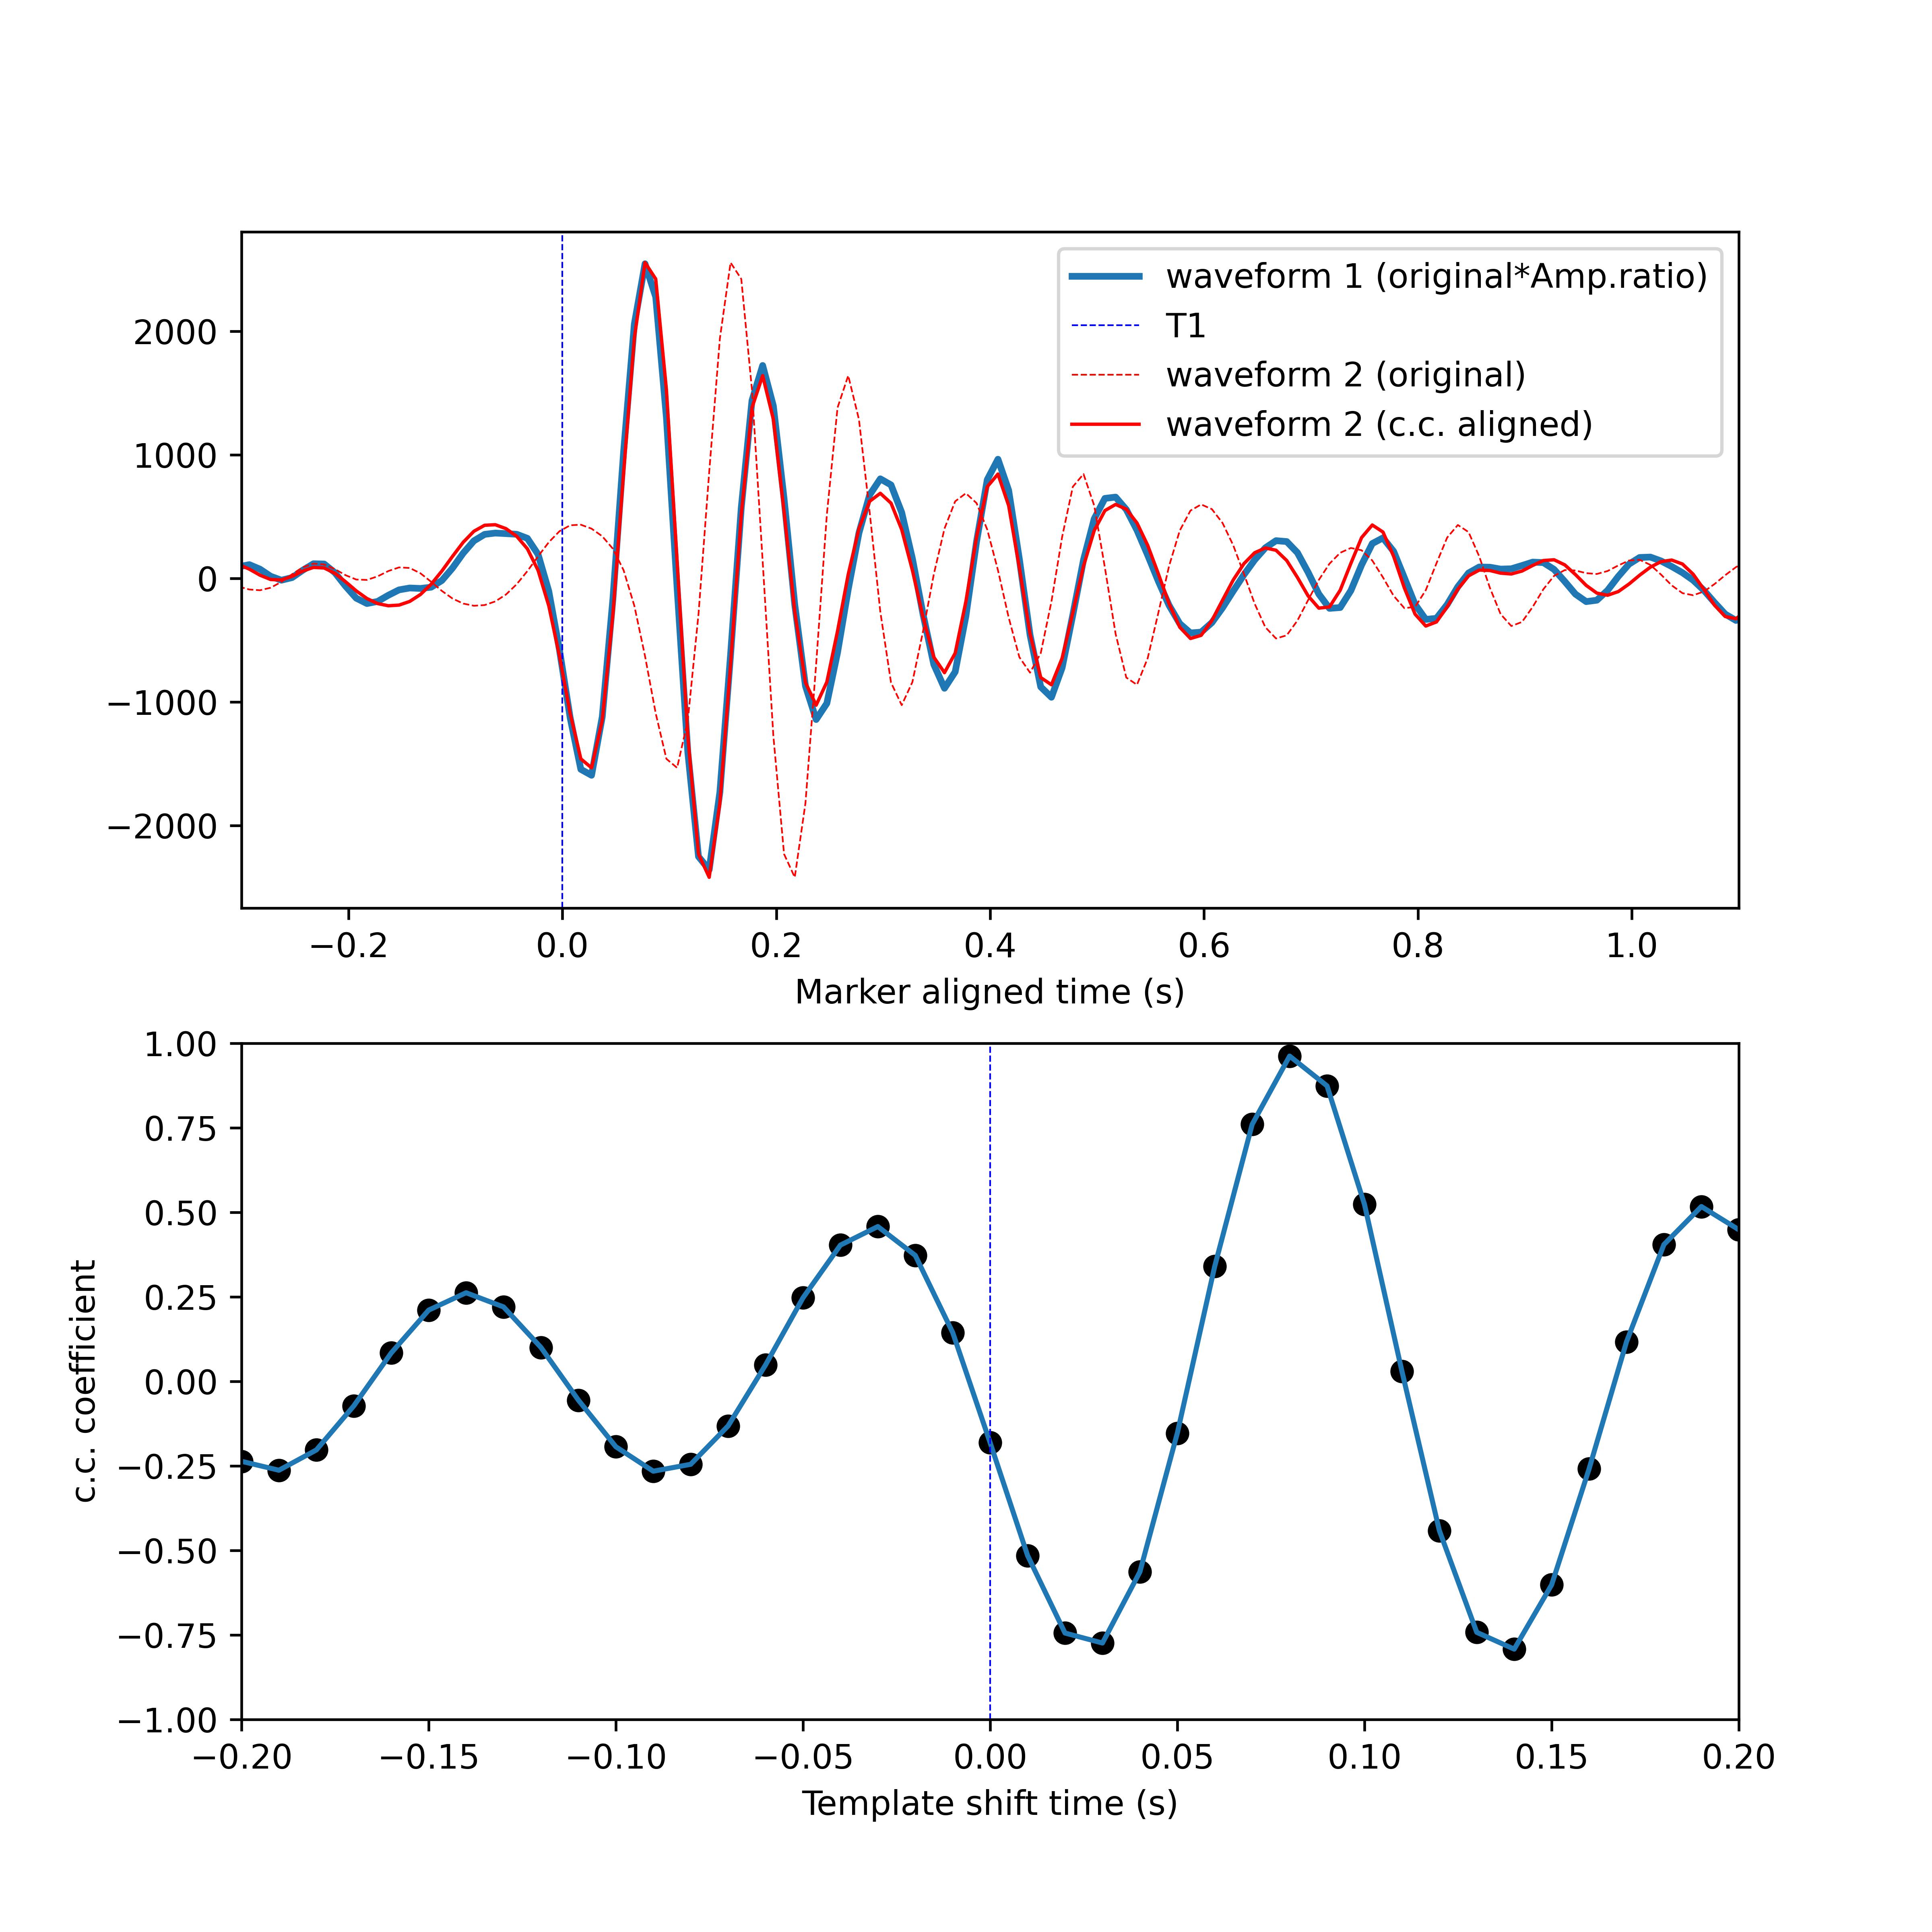
Example illustrating how sliding-window cross-correlation (SCC) works. (up) The blue line is the template waveform that could slide over the target waveform (red dashed line). The solid red line is the shifted target waveform with the shift amount estiamted from the cross-correlation. (below) Changes of the cross-correlation coefficient during the sliding-window cross-correlation process.
During the practical usage, we have the demand to conduct SCC and have a plot of the results so that we could set
proper parameters (e.g., set the proper length of the template). Therefore, I develped
a python function wf_scc that can be used to satisfy the demand. Below is the function output figure of the
three-component waveform cross-correlation with the parameter pltMkr==True.
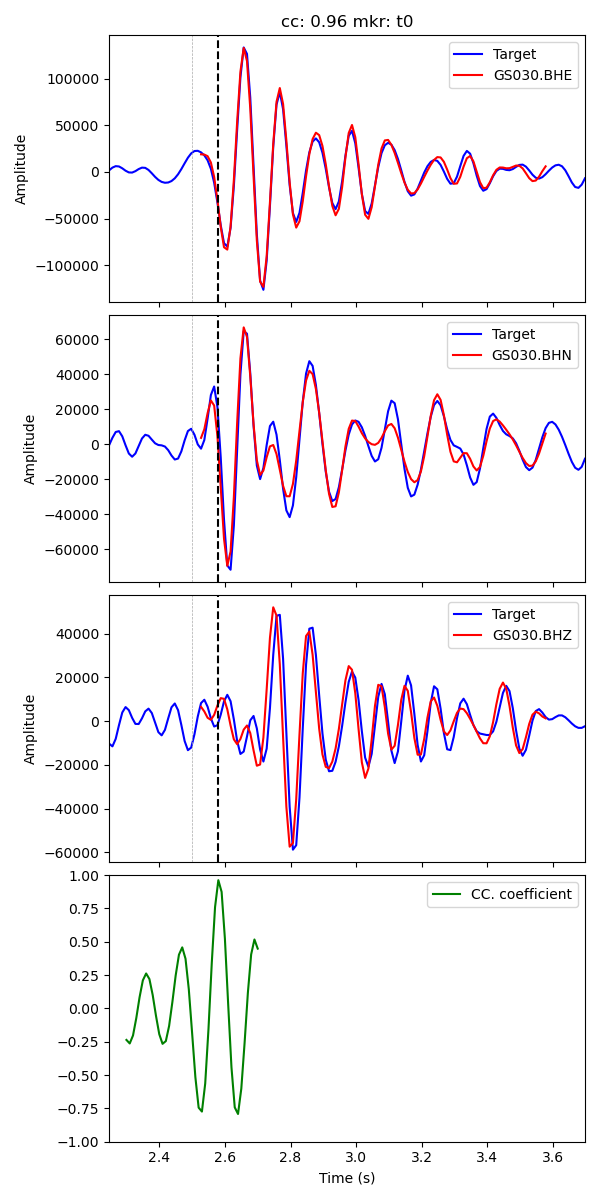
The output figure of the function wf_scc. The red waveforms are the tempalte and the blue waveforms are the target waveforms.
The t0 mkr here represents S waves.
X-axis is the time with reference to the target waveform reference time, which is generally the event origin time.
It is shown that the consistent S pick of the traget waveform is ~2.6s (black dashed line),
which is slightly later the original S pick (darkgrey dashed line). The template waveforms are scaled to the target waveform amplitude
by multiply their amplitude ratio.
The computation kernel follows the SCC programme by Prof. Lupei Zhu and is boosted its efficiency in python using numba.jit()
Features
def wf_scc(st1,st2,tb,te,maxShift,mkr='t0',
         pltMkr=False,pltccThred=0.7,figDir="./seisloc_wf_scc_plots",figNm=None):
   """
   Sliding-window cross-correlation between template and target waveform
   Reference time should be the event origin time
   reference: Yang et al.,2009, BSSA.

   Parameters
   -----------
         st1: template waveform of one station
         st2: target waveform of the same station
       tb,te: begin and end time window for waveform center on the corresponding marker
    maxShift: maximum shift value for sliding, in seconds
         mkr: markers for preparing waveforms for cross-correlation. Generally 'a'
              for P arrival and 't0' for S arrival
      pltMkr: If True, output figure in the figDir
  pltccThred: only plot figures with maximum cc. value greater than the threshold
      figDir: the directory saving waveforms cross-correlation output figures
       figNm: name of the output figure. If None, then a figure name with information
               of reference times and station name with be assigned

   Return
   -----------
      ccmax: maximum cross-correlation coefficient
      aamax: amplitude ratio at ccmax
   bestTime: the best arrival time of st2(sta_st)
      ccLst: cross-correlation values
   """
Features: - The waveforms should be in SAC format with
ohead field set. - Sliding-window cross-correlation (SCC) for three-component waveforms. - Output maximum cross-correlation coefficient and coresponding amplitude ratio and travel time with reference to the origin time.
Download the source code and example here
Note
FDTCC in LOC-FLOW